- Analytik
- Technische Analyse
Australischem Aktienindex Technische Analyse - Australischem Aktienindex Handel: 2019-04-12
Rising trade surplus bullish for Australian stock index
Trade surplus and consumer sentiment rose in Australia. Will the AU200 stock index continue advancing?
Australian data after central bank’s April 1 interest rate decision were positive on balance: contractions in the services sector and construction were weaker in March compared to performances in previous month, and balance of trade surplus grew more than expected in February to the largest on record, as exports reached an all-time high while imports fell. Retail sales growth over month accelerated in February, which was accompanied by growth in home loans. At the same time consumer sentiment improved: Westpac Bank Consumer Sentiment Index increased by 1.9% over month to 100.7 in April 2019 from 98.8 in the previous month. With progress in US-China trade talks prospects improve also for global growth, implying support for commodities demand which are Australia’s main export items. Rising trade surplus and consumer sentiment is bullish for Australia’s stock market index.
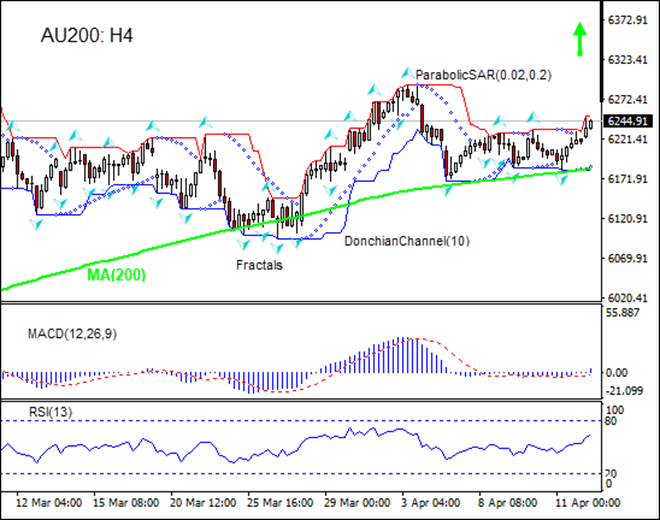
On the 4-hour timeframe AU200: H4 is gaining after hitting seven-month low in the end of February.
- The Donchian channel indicates an uptrend: it is widening upward.
- The Parabolic indicator has formed a buy signal.
- The MACD indicator is above the signal line and the gap is widening, which is a bullish signal.
- The RSI oscillator is rising but has not reached the overbought zone.
We believe the bullish momentum will continue after the price closes above the upper boundary of Donchian channel at 6250.60. This level can be used as an entry point for placing a pending order to buy. The stop loss can be placed below the lower Donchian boundary at 6181.88. After placing the order, the stop loss is to be moved every day to the next fractal low, following Parabolic signals. Thus, we are changing the expected profit/loss ratio to the breakeven point. If the price meets the stop loss level (6181.88) without reaching the order (6250.60), we recommend cancelling the order: the market has undergone internal changes which were not taken into account.
Technical Analysis Summary
| Position | Buy |
| Buy stop | Above 6250.60 |
| Stop loss | Below 6181.88 |
- Zertifikat erhalten

Hinweis:
Diese Übersicht hat einen informativen und Tutorencharakter und wird kostenlos veröffentlicht. Alle Daten, die in dieser Übersicht eingeschlossen sind, sind von mehr oder weniger zuverlässigen öffentlichen Quellen erhalten. Außerdem gibt es keine Garantie, dass die angezeigte Information voll und genau ist. Die Übersichten werden nicht aktualisiert. Die ganze Information in jeder Übersicht, einschließlich Meinungen, Hinweise, Charts und alles andere, werden nur für Vertrautmachen veröffentlicht und sind keine Finanzberatung oder Empfehlung. Der ganze Text und sein jeder Teil sowie die Charts können nicht als ein Geschäftsangebot betrachtet werden. Unter keinen Umständen sind IFC Markets und seine Angestellten für die Handlungen, die von jemand anderem während oder nach dem Lesen der Übersicht genommen werden, verantwortlich.
