- Analytik
- Technische Analyse
Australischem Aktienindex Technische Analyse - Australischem Aktienindex Handel: 2019-08-06
World Stock Indices Down
Falling quotations are observed in almost all world stock markets. Will the australian stock index AU200 fall?
On Monday, August 5, 2019, the RMB rate collapsed and exceeded the psychological level of 7 yuan per US dollar, the first time since May 2008. This was a reaction to an increase in US import duties of 10% from September 1, 2019 on the supply of Chinese goods worth $ 300 billion a year. Investors regarded the actual devaluation of the renminbi as a significant increase in global risks and trade wars. All global stock indices fell, and gold quotes soared to a 6-year high. The Australian S&P/ ASX 200 on Monday showed the maximum daily drop in 7 months. China is Australia's main foreign trade partner with a share of about 30% of its exports. The problems of the Chinese economy can negatively affect the shares of Australian companies. The current P / E ratio (capitalization / net profit for the year) for the S&P/ ASX 200 is 17.2. Despite the decline in recent days, it is 17.6% higher than at the beginning of 2019.
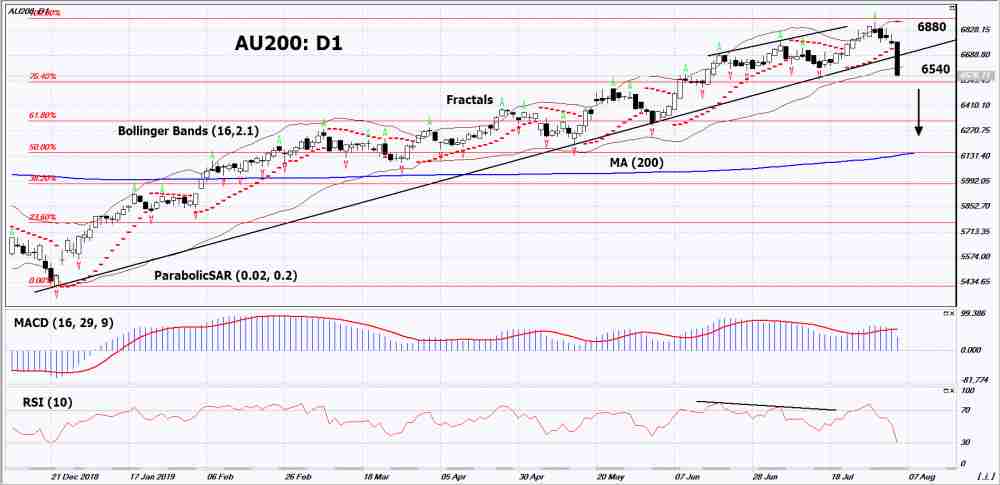
On a daily timeframe AU200: D1exeeded the growing trend and adjusted down. Most indicators of technical analysis formed a signal to decline. A drop in prices is possible in the event of a slowdown in the global and Australian economies.
- The Parabolic indicator demonstrates a downtrend signal.
- The Bolinger bands narrowed, indicating a decrease in volatility. The top line has a downward slope.
- The RSI indicator is below the 50 mark. No new divergence is observed.
- The MACD indicator gives a bearish signal.
The bearish momentum may develop if AU200 drops below the 1st Fibonacci level: 6540. This level can be used as an entry point. The initial stop loss may be placed higher than the last upper fractal, Parabolic signal, historical maximum and Bollinger upper line: 6880. After opening a pending order, stop shall be moved following the Bollinger and Parabolic signals to the next fractal maximum. Thus, we are changing the potential profit/loss to the breakeven point. More risk-averse traders may switch to the 4-hour chart after the trade and place a stop loss moving it in the direction of the trade. If the price meets the stop level (6880) without reaching the order (6540), we recommend to cancel the order: the market sustains internal changes that were not taken into account.
Technical Analysis Summary
| Position | Sell |
| Sell stop | Below 6540 |
| Stop loss | Above 6880 |
- Zertifikat erhalten

Hinweis:
Diese Übersicht hat einen informativen und Tutorencharakter und wird kostenlos veröffentlicht. Alle Daten, die in dieser Übersicht eingeschlossen sind, sind von mehr oder weniger zuverlässigen öffentlichen Quellen erhalten. Außerdem gibt es keine Garantie, dass die angezeigte Information voll und genau ist. Die Übersichten werden nicht aktualisiert. Die ganze Information in jeder Übersicht, einschließlich Meinungen, Hinweise, Charts und alles andere, werden nur für Vertrautmachen veröffentlicht und sind keine Finanzberatung oder Empfehlung. Der ganze Text und sein jeder Teil sowie die Charts können nicht als ein Geschäftsangebot betrachtet werden. Unter keinen Umständen sind IFC Markets und seine Angestellten für die Handlungen, die von jemand anderem während oder nach dem Lesen der Übersicht genommen werden, verantwortlich.
