- Analytik
- Technische Analyse
Mais Technische Analyse - Mais Handel: 2019-10-10
High demand bullish for corn price
US export sales were stronger than forecast while quality ratings declined last week. Will the corn price continue rising?
On the demand side US corn export inspections improved slightly last week compared to the one previous the last, rising to 18.4 million bushels from 16.6 million bushels up due to heavy buying from Mexico. On the other hand USDA crop progress report Monday reinforced supply concerns: quality ratings fell another point to 56% in good-to-excellent condition. And harvest is moving slower than expected, with 15% completed as of October 6. Higher demand and lower expected crop is bullish for corn prices. Today’s US Department of Agriculture monthly World Agricultural Supply and Demand Estimates report may be a downside risk in case of higher crop supply estimates
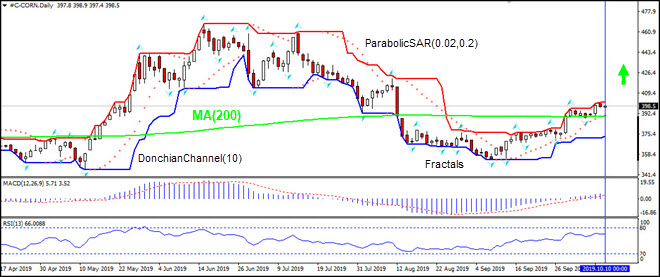
On the daily timeframe the CORN: D1 has been rising after closing above the 200-day moving average MA(200).
- The Parabolic indicator has formed a buy signal.
- The Donchian channel indicates uptrend: it is narrowing up.
- The MACD indicator gives a bullish signal: it is above the signal line and the gap is widening.
- The RSI oscillator is above 50 level and has not reached the overbought zone.
We expect the bullish momentum will resume after the price breaches above the upper Donchian bound at 401.5. A price above that level can be used as an entry point for a pending order to buy. The stop loss can be placed below the fractal low at 388.3. After placing the pending order, the stop loss is to be moved to the next fractal low, following Parabolic signals. By doing so, we are changing the expected profit/loss ratio to the breakeven point. If the price meets the stop loss level (388.3) without reaching the order, we recommend canceling the order: the market sustains internal changes which were not taken into account.
Technical Analysis Summary
| Order | Buy |
| Buy stop | Above 401.5 |
| Stop loss | Below 388.3 |
- Zertifikat erhalten

Hinweis:
Diese Übersicht hat einen informativen und Tutorencharakter und wird kostenlos veröffentlicht. Alle Daten, die in dieser Übersicht eingeschlossen sind, sind von mehr oder weniger zuverlässigen öffentlichen Quellen erhalten. Außerdem gibt es keine Garantie, dass die angezeigte Information voll und genau ist. Die Übersichten werden nicht aktualisiert. Die ganze Information in jeder Übersicht, einschließlich Meinungen, Hinweise, Charts und alles andere, werden nur für Vertrautmachen veröffentlicht und sind keine Finanzberatung oder Empfehlung. Der ganze Text und sein jeder Teil sowie die Charts können nicht als ein Geschäftsangebot betrachtet werden. Unter keinen Umständen sind IFC Markets und seine Angestellten für die Handlungen, die von jemand anderem während oder nach dem Lesen der Übersicht genommen werden, verantwortlich.
