- Analytik
- Technische Analyse
Hang Seng Index Technische Analyse - Hang Seng Index Handel: 2019-02-01
Better than expected Chinese data bullish for HK50
Contraction in China’s manufacturing sector slowed while services sector expansion accelerated in January. Will the HK50 continue rising?
Latest Chinese economic data were better than expected: manufacturing contracted at slower pace and services sector expansion accelerated. The factory activity contraction slowed as the official Manufacturing PMI inched higher to 49.5 in January from 49.4 in the previous month when a decline to 49.3 was expected. At the same time the official Non-Manufacturing PMI in China increased from 53.8 in December to 54.7 in January, a four-month high. The services sector accounts for more than half of the Chinese economy. Better than expected Chinese economic data are bullish for Hong Kong stock index.
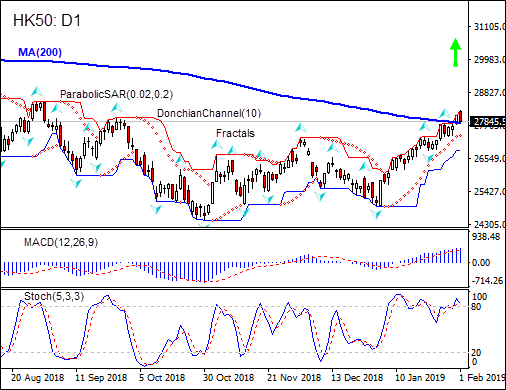
On the daily timeframe the HK50: D1 is retracing higher after hitting one-month low in the beginning of January. It is testing 200-day moving average MA(200)
- The Parabolic indicator gives a buy signal.
- The Donchian channel indicates uptrend: it is widening up.
- The MACD indicator gives a bullish signal: it is above the signal line and the gap is widening.
- The Stochastic oscillator is falling but is still in the overbought zone, this is bearish.
We believe the bullish momentum will continue after the price closes above the upper boundary of Donchian channel at 28208.0. This level can be used as an entry point for placing a pending order to buy. The stop loss can be placed below the lower Donchian boundary at 26832.0. After placing the order, the stop loss is to be moved every day to the next fractal low, following Parabolic signals. Thus, we are changing the expected profit/loss ratio to the breakeven point. If the price meets the stop loss level (26832) without reaching the order (28208), we recommend cancelling the order: the market has undergone internal changes which were not taken into account.
Technical Analysis Summary
| Position | Buy |
| Buy stop | Above 28208 |
| Stop loss | Below 26832 |
- Zertifikat erhalten

Hinweis:
Diese Übersicht hat einen informativen und Tutorencharakter und wird kostenlos veröffentlicht. Alle Daten, die in dieser Übersicht eingeschlossen sind, sind von mehr oder weniger zuverlässigen öffentlichen Quellen erhalten. Außerdem gibt es keine Garantie, dass die angezeigte Information voll und genau ist. Die Übersichten werden nicht aktualisiert. Die ganze Information in jeder Übersicht, einschließlich Meinungen, Hinweise, Charts und alles andere, werden nur für Vertrautmachen veröffentlicht und sind keine Finanzberatung oder Empfehlung. Der ganze Text und sein jeder Teil sowie die Charts können nicht als ein Geschäftsangebot betrachtet werden. Unter keinen Umständen sind IFC Markets und seine Angestellten für die Handlungen, die von jemand anderem während oder nach dem Lesen der Übersicht genommen werden, verantwortlich.
