- Analytik
- Technische Analyse
Hang Seng Index Technische Analyse - Hang Seng Index Handel: 2019-07-18
Contraction in private sector bearish for HK50
Hong Kong’s private sector contraction continued in June. Will the HK50 decline?
Recent Hong Kong economic data were weak after the positive trade report three weeks ago showing the trade deficit in Hong Kong continued to decrease in May. Retail sales continued to fall in May albeit at a slower pace than in April: 1.7% over year versus 5% in April. And the June reading of purchasing managers index was below 50 again, indicating contraction in the private sector. Activities in private sector contracted for the fifteenth straight month as new orders dropped, pointing to weakness ahead too. The slump in activities is being attributed to US-China trade tensions, and there are no indications the dispute can be resolved soon. On Tuesday President Trump said he could impose tariffs on another $325 billion of imports from China after telling US and China ‘had long way to go’ before a deal. Continuing decline in activities in private business sector is bearish for HK 50.
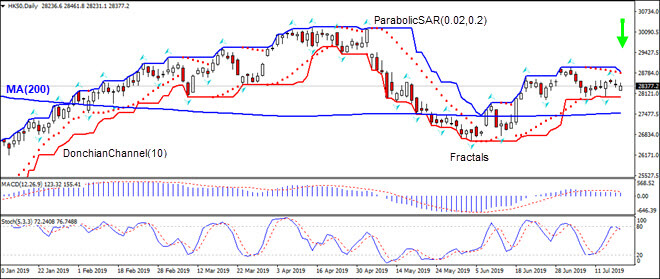
On the daily timeframe HK50: D1 is retracing lower after rebound following the decline to 8-month low in the beginning of May.
- The Parabolic indicator gives a sell signal.
- The Donchian channel indicates downtrend: it is narrowing down.
- The MACD indicator is above the signal line with the gap narrowing. This is a bearish signal.
- The Stochastic oscillator is falling back from the overbought zone.
We believe the bearish momentum will continue after the price breaches below the lower Donchian boundary at 28021.3. This level can be used as an entry point for placing a pending order to sell. The stop loss can be placed below the lower Donchian boundary at 28830.7. After placing the pending order the stop loss is to be moved every day to the next fractal high, following Parabolic signals. Thus, we are changing the expected profit/loss ratio to the breakeven point. If the price meets the stop-loss level (28830.7) without reaching the order (28021.3) we recommend cancelling the order: the market sustains internal changes which were not taken into account.
Technical Analysis Summary
| Position | Sell |
| Sell Stop | Above 28021.3 |
| Stop loss | Below 28830.7 |
- Zertifikat erhalten

Hinweis:
Diese Übersicht hat einen informativen und Tutorencharakter und wird kostenlos veröffentlicht. Alle Daten, die in dieser Übersicht eingeschlossen sind, sind von mehr oder weniger zuverlässigen öffentlichen Quellen erhalten. Außerdem gibt es keine Garantie, dass die angezeigte Information voll und genau ist. Die Übersichten werden nicht aktualisiert. Die ganze Information in jeder Übersicht, einschließlich Meinungen, Hinweise, Charts und alles andere, werden nur für Vertrautmachen veröffentlicht und sind keine Finanzberatung oder Empfehlung. Der ganze Text und sein jeder Teil sowie die Charts können nicht als ein Geschäftsangebot betrachtet werden. Unter keinen Umständen sind IFC Markets und seine Angestellten für die Handlungen, die von jemand anderem während oder nach dem Lesen der Übersicht genommen werden, verantwortlich.
