- Analytik
- Technische Analyse
Magerschwein Technische Analyse - Magerschwein Handel: 2018-12-13
Lower pig supply bullish for LHOG
Spread of African swine fever in China negatively affects supply of pigs in the world’s largest pork consumption market. Will the LHOG continue gaining?
Still new cases of African swine fever (ASF) outbreak are being reported in China after the first case in August. This time pigs in farms from two cities were found dead as a result of ASF - in cities of Shaanxi in the north and Guiyang, from southern province of Guizhou. China is the top pork consumer in the world with about 55 million tons of pork consumption last year. Lower pig supply is bullish for LHOG. At the same time China has restarted trade negotiations with US and has started to buy large amounts of agricultural commodities like soy beans it stopped buying as a retaliation for US import tariffs. Resumption of China’s halted imports from US also will support prices.
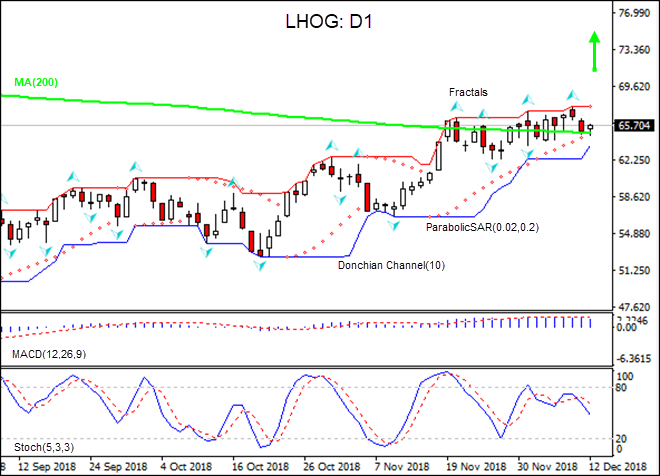
On the daily timeframe the LHOG: D1 has breached above the 200-day moving average MA(200).
- The Parabolic indicator gives a sell signal.
- The Donchian channel indicates uptrend: it is narrowing up.
- The MACD indicator gives a bearish signal: it is above the signal line and the gap is narrowing.
- The Stochastic oscillator is falling but has not breached into the oversold zone.
We believe the bullish momentum will continue after the price breaches above the upper boundary of Donchian channel at 67.676. This level can be used as an entry point for placing a pending order to buy. The stop loss can be placed below the lower Donchian boundary at 63.795. After placing the order, the stop loss is to be moved every day to the next fractal low, following Parabolic signals. Thus, we are changing the probable profit/loss ratio to the breakeven point. If the price meets the stop loss level (63.795) without reaching the order (67.676), we recommend cancelling the order: the market has undergone internal changes which were not taken into account.
Technical Analysis Summary
| Position | Buy |
| Buy stop | Above 67.676 |
| Stop loss | Below 63.795 |
- Zertifikat erhalten

Hinweis:
Diese Übersicht hat einen informativen und Tutorencharakter und wird kostenlos veröffentlicht. Alle Daten, die in dieser Übersicht eingeschlossen sind, sind von mehr oder weniger zuverlässigen öffentlichen Quellen erhalten. Außerdem gibt es keine Garantie, dass die angezeigte Information voll und genau ist. Die Übersichten werden nicht aktualisiert. Die ganze Information in jeder Übersicht, einschließlich Meinungen, Hinweise, Charts und alles andere, werden nur für Vertrautmachen veröffentlicht und sind keine Finanzberatung oder Empfehlung. Der ganze Text und sein jeder Teil sowie die Charts können nicht als ein Geschäftsangebot betrachtet werden. Unter keinen Umständen sind IFC Markets und seine Angestellten für die Handlungen, die von jemand anderem während oder nach dem Lesen der Übersicht genommen werden, verantwortlich.
