- Analytik
- Technische Analyse
NASDAQ Index Technische Analyse - NASDAQ Index Handel: 2019-06-19
Positive data bullish for Nd100
US retail sales and industrial production rose in May. Will the Nd100 stock index continue advancing?
US economic data were positive on balance ahead of Federal Reserve meeting: US retail sales grew 0.5% in May, and sales were revised to 0.3% growth for April after an initial estimate of 0.2% decline. US industrial production rose 0.4% in May, when 0.2% rise was expected, and utilization edged up 0.2 percentage point to 78.1%. And while home builder confidence declined slightly in June, it still recorded improvement: the reading from the National Association of Home Builders survey for June showed that home builder confidence fell two points to 64 in June. However, any reading over 50 signals improvement. At the time the Federal Reserve is viewed to be leaning toward easing after prolonged US-China tariff standoff damped market sentiment positive economic data are bullish for US equities market.
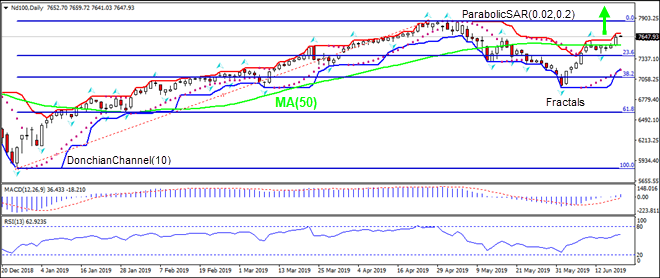
On the daily timeframe Nd100: D1 is rising after closing below Fibonacci 38.2 level. It has returned above 50-day moving average MA(50). These are bullish developments.
- The Donchian channel indicates uptrend: it is tilted up.
- The Parabolic indicator has formed a buy signal.
- The MACD indicator is above the signal line and the gap is widening, which is a bullish signal.
- The RSI oscillator is rising but has not reached the overbought zone.
We believe the bullish momentum will continue as the price breaches above the upper boundary of Donchian channel at 7688.09. This level can be used as an entry point for placing a pending order to buy. The stop loss can be placed below the lower Donchian boundary at 7417.51. After placing the order, the stop loss is to be moved every day to the next fractal low, following Parabolic signals. Thus, we are changing the expected profit/loss ratio to the breakeven point. If the price meets the stop loss level (7417.51) without reaching the order (7688.09), we recommend cancelling the order: the market has undergone internal changes which were not taken into account.
Technical Analysis Summary
| Order | Buy |
| Buy stop | Above 7688.09 |
| Stop loss | Below 7417.51 |
- Zertifikat erhalten

Hinweis:
Diese Übersicht hat einen informativen und Tutorencharakter und wird kostenlos veröffentlicht. Alle Daten, die in dieser Übersicht eingeschlossen sind, sind von mehr oder weniger zuverlässigen öffentlichen Quellen erhalten. Außerdem gibt es keine Garantie, dass die angezeigte Information voll und genau ist. Die Übersichten werden nicht aktualisiert. Die ganze Information in jeder Übersicht, einschließlich Meinungen, Hinweise, Charts und alles andere, werden nur für Vertrautmachen veröffentlicht und sind keine Finanzberatung oder Empfehlung. Der ganze Text und sein jeder Teil sowie die Charts können nicht als ein Geschäftsangebot betrachtet werden. Unter keinen Umständen sind IFC Markets und seine Angestellten für die Handlungen, die von jemand anderem während oder nach dem Lesen der Übersicht genommen werden, verantwortlich.
