- Analytik
- Technische Analyse
Sojabohnen Technische Analyse - Sojabohnen Handel: 2018-12-03
The US and China can remove part of the mutual restrictions in foreign trade
The leaders of the United States and China will negotiate at the G20 summit. Among other things, they will discuss issues of US soybean imports to China. Will SOYB prices rise?
In April of the current year, China increased import duties on US soybeans by 25% in response to restrictions on exports of a number of Chinese goods to the United States. After that, soybean prices also fell by nearly a quarter. In 2017, China accounted for 56% of US soybean exports. US President Donald Trump and Chinese President Xi Jinping participate in the G20 summit, which will be held from November 30 to December 1, 2018 in Argentina. The United States accounts for 35% of the world soybean harvest and another 33% and 14% are produced by Brazil and Argentina. In world soybean exports, the United States accounts for 37%. Brazil accounts for 47% and Argentina - only 5%. In case of a reduction in customs tariffs and resumption of US soybean supplies to China, its prices may noticeably increase.
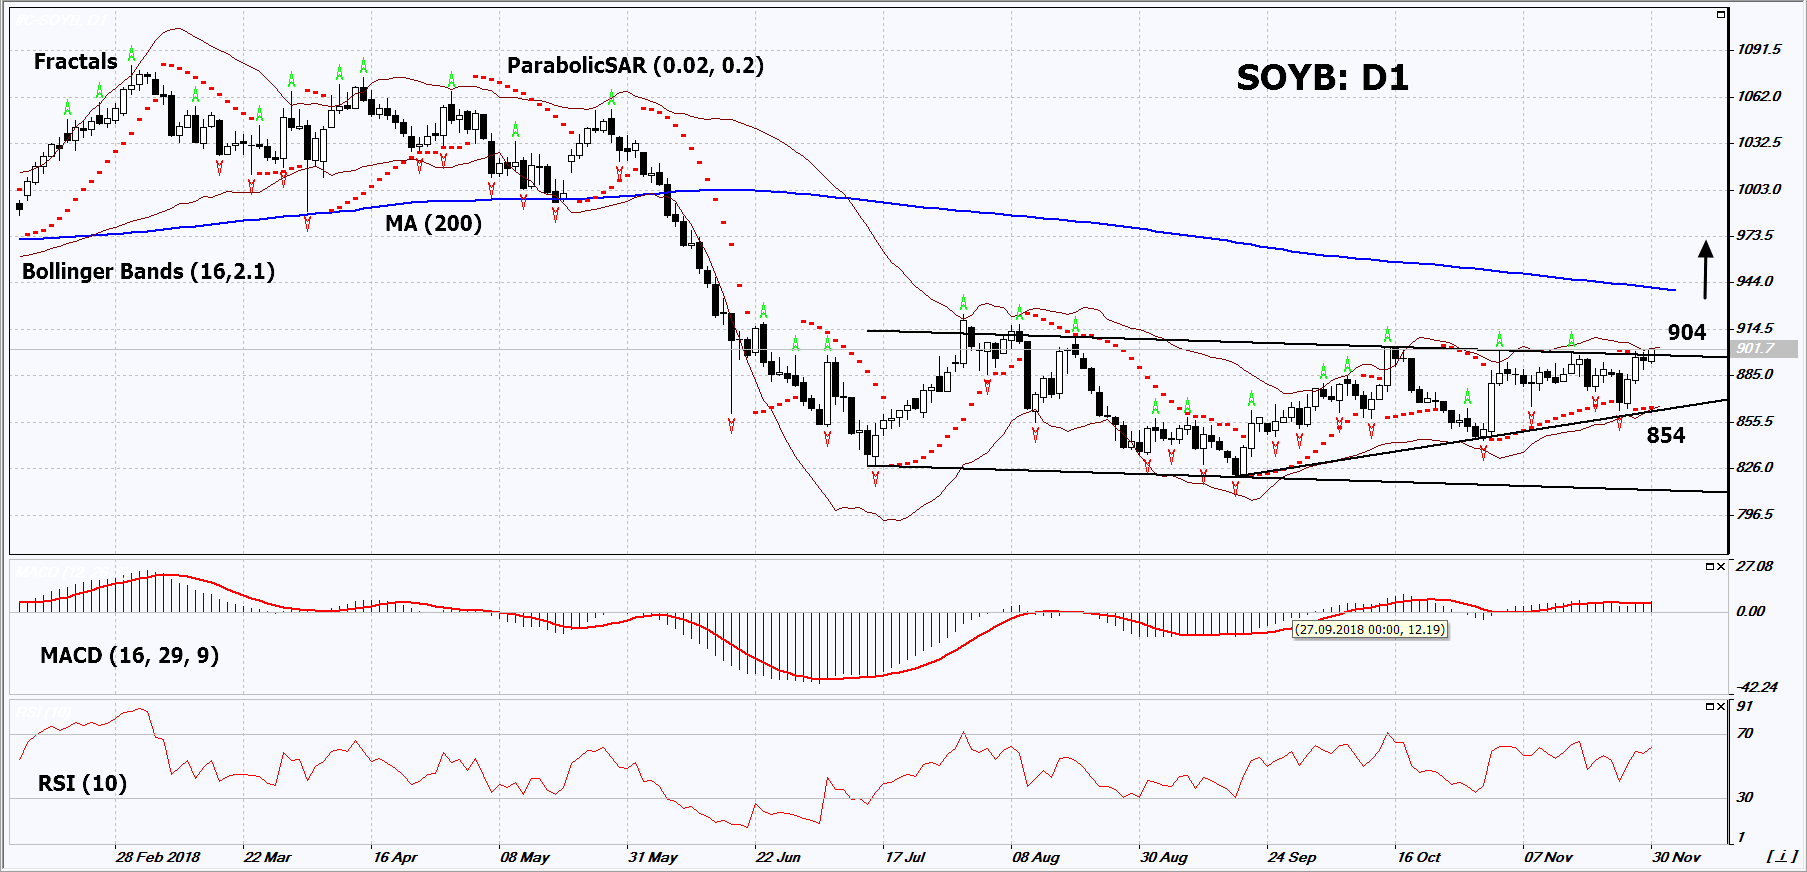
On the daily timeframe, SOYB: D1 approached the upper boundary of the neutral range. A number of technical analysis indicators formed buy signals. The further price increase is possible in case of a resumption of demand by non-Chinese buyers and a reduction in duties.
- The Parabolic indicator gives a bullish signal.
- The Bollinger bands have narrowed, which indicates low volatility. Both bands are titled upwards.
- The RSI indicator is above 50. It has not reached the overbought area yet. No divergence.
- The MACD indicator gives a bullish signal.
The bullish momentum may develop in case SOYB exceeds the three last fractal highs and the upper Bollinger band at 904. This level may serve as an entry point. The initial stop loss may be placed below the last fractal low, the lower Bollinger band and the Parabolic signal at 854. After opening the pending order, we shall move the stop to the next fractal low following the Bollinger and Parabolic signals. Thus, we are changing the potential profit/loss to the breakeven point. More risk-averse traders may switch to the 4-hour chart after the trade and place there a stop loss moving it in the direction of the trade. If the price meets the stop level (854) without reaching the order (904), we recommend to close the position: the market sustains internal changes that were not taken into account.
Summary of technical analysis
| Position | Buy |
| Buy stop | Above 904 |
| Stop loss | Below 854 |
- Zertifikat erhalten

Hinweis:
Diese Übersicht hat einen informativen und Tutorencharakter und wird kostenlos veröffentlicht. Alle Daten, die in dieser Übersicht eingeschlossen sind, sind von mehr oder weniger zuverlässigen öffentlichen Quellen erhalten. Außerdem gibt es keine Garantie, dass die angezeigte Information voll und genau ist. Die Übersichten werden nicht aktualisiert. Die ganze Information in jeder Übersicht, einschließlich Meinungen, Hinweise, Charts und alles andere, werden nur für Vertrautmachen veröffentlicht und sind keine Finanzberatung oder Empfehlung. Der ganze Text und sein jeder Teil sowie die Charts können nicht als ein Geschäftsangebot betrachtet werden. Unter keinen Umständen sind IFC Markets und seine Angestellten für die Handlungen, die von jemand anderem während oder nach dem Lesen der Übersicht genommen werden, verantwortlich.
