- Analytik
- Technische Analyse
Sojabohnen Technische Analyse - Sojabohnen Handel: 2019-05-03
High US supply expectations bearish for soybean prices
High US soybean supply estimate is expected to be reported in May WASDE report. Will the soybean prices continue declining?
The USDA is expected to report high soybean supply in its monthly World Agricultural Supply and Demand Estimate to be released on May 10. And while China and US negotiators appear close to reaching a trade deal, China’s import demand appears significantly impaired as African swine fever devastated the country’s hog industry: China’s imports through March were down 17% from year-ago levels. And weather patterns point to increasing likelihood of high US soybean yields contributing to a record crop for seventh year in a row as El Nino extends into autumn. Higher supply estimates are bearish for soybean.
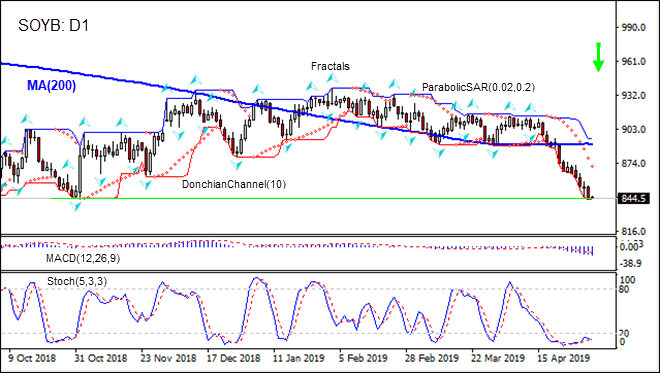
On the daily timeframe the SOYB: D1 is below the 200-day moving average MA(200) which is flat.
- The Parabolic indicator gives a sell signal.
- The Donchian channel indicates no trend yet: it is flat.
- The MACD indicator gives a bearish signal: it is below the signal line and the gap is widening.
- The Stochastic oscillator is in the oversold zone, this is bullish.
We believe the bearish momentum will continue after the price breaches below the lower boundary of Donchian channel at 843.3. This level can be used as an entry point for placing a pending order to sell. The stop loss can be placed above the upper Donchian boundary at 894.9. After placing the order, the stop loss is to be moved every day to the next fractal high, following Parabolic signals. Thus, we are changing the expected profit/loss ratio to the breakeven point. If the price meets the stop loss level (894.9) without reaching the order (843.3), we recommend cancelling the order: the market has undergone internal changes which were not taken into account.
Technical Analysis Summary
| Position | Sell |
| Sell stop | Below 843.3 |
| Stop loss | Above 894.9 |
- Zertifikat erhalten

Hinweis:
Diese Übersicht hat einen informativen und Tutorencharakter und wird kostenlos veröffentlicht. Alle Daten, die in dieser Übersicht eingeschlossen sind, sind von mehr oder weniger zuverlässigen öffentlichen Quellen erhalten. Außerdem gibt es keine Garantie, dass die angezeigte Information voll und genau ist. Die Übersichten werden nicht aktualisiert. Die ganze Information in jeder Übersicht, einschließlich Meinungen, Hinweise, Charts und alles andere, werden nur für Vertrautmachen veröffentlicht und sind keine Finanzberatung oder Empfehlung. Der ganze Text und sein jeder Teil sowie die Charts können nicht als ein Geschäftsangebot betrachtet werden. Unter keinen Umständen sind IFC Markets und seine Angestellten für die Handlungen, die von jemand anderem während oder nach dem Lesen der Übersicht genommen werden, verantwortlich.
