- Analytik
- Technische Analyse
Zucker Technische Analyse - Zucker Handel: 2018-12-10
Demand for biofuels may increase in Brazil
A major ethanol producer in Brazil forecasts an increase in the proportion of sugarcane intended for biofuel production. Will sugar prices rise?
The COFCO believes that world sugar prices will depend on the cost of fuel in Brazil. According to its estimates, from 33.5% to 48.6% of the sugar cane harvest can be intended for the production of biofuels in the 2019/20 agricultural season. OPEC’ decision to cut the production by 1.2 million barrels per day from 2019 may increase world oil prices and demand for biofuels. Let us note that according to the Brazilian Sugarcane Industry Association (Unica), from April 1 to November 16, 2018, sugar production in central and southern Brazil decreased by 26.8% compared to the same period of the last year. Brazil produces more than 20% of the world’s sugar. At the same time, it accounts for almost half of global sugar exports.
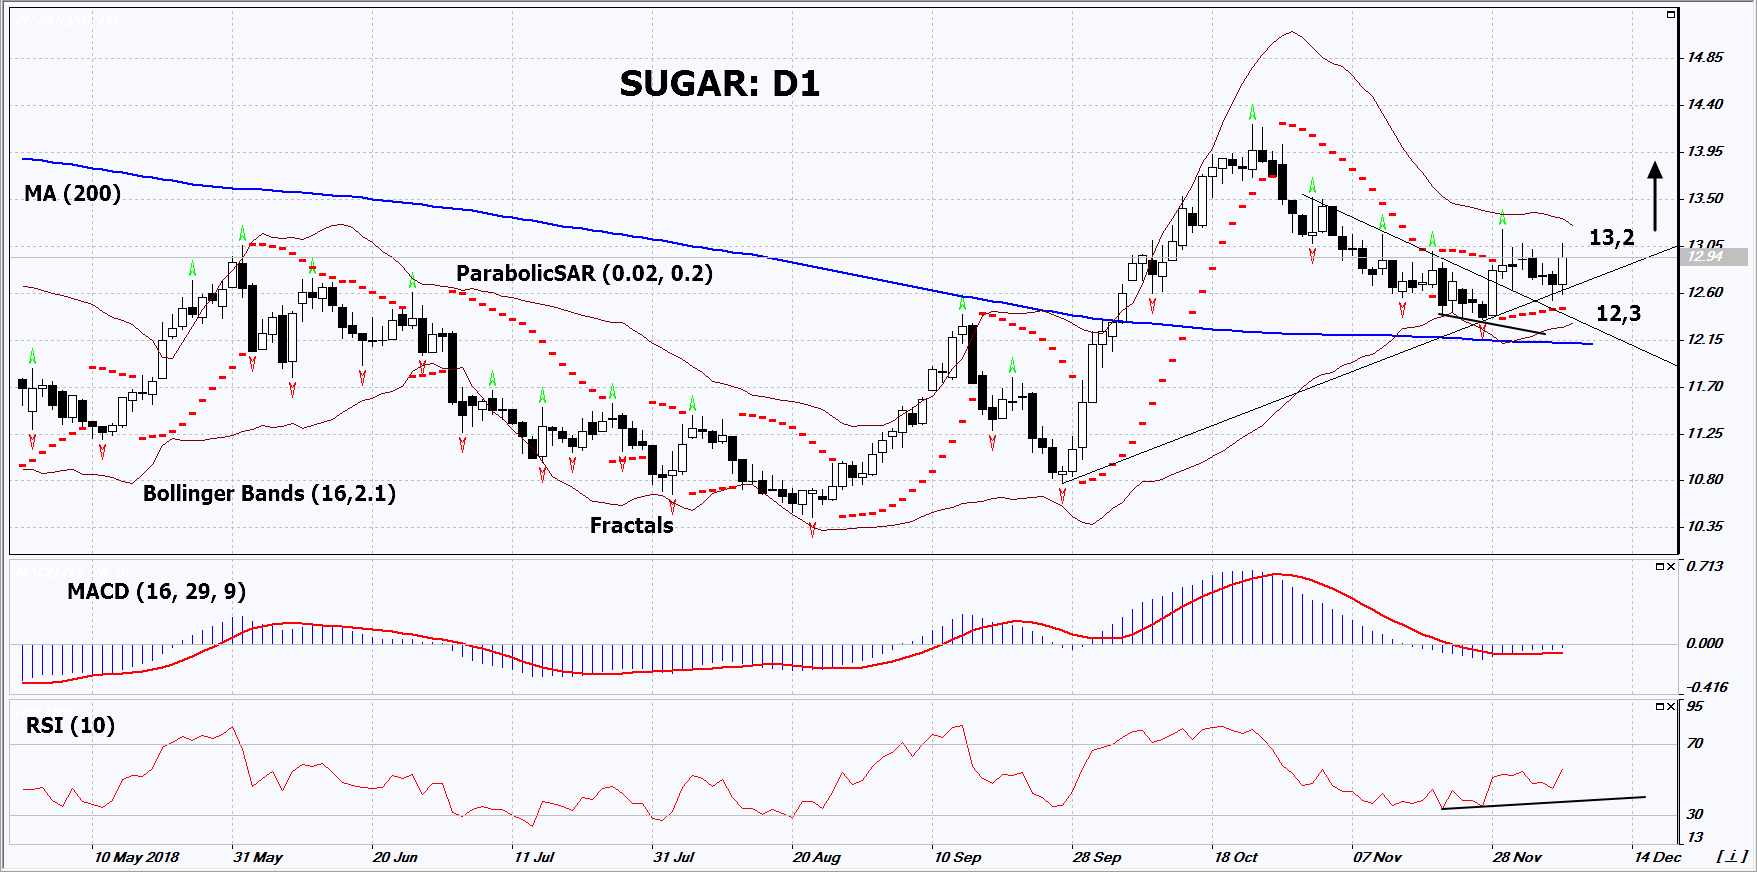
On the daily timeframe, SUGAR: D1 has breached up the resistance line of the downtrend and is trying to form a growing trend. The further price growth is possible in case of an increase in demand for biofuels.
- The Parabolic indicator gives a bullish signal.
- The Bollinger bands have narrowed, which indicates low volatility. The lower band is titled upward.
- The RSI indicator is above 50, but it has not reached the overbought area yet. It has formed a positive divergence.
- The MACD indicator gives a bullish signal.
The bullish momentum may develop in case SUGAR exceeds the last fractal high and the upper Bollinger band at 13.2. This level may serve as an entry point. The initial stop loss may be placed below the last fractal low, the Parabolic signal and the lower Bollinger band at 12.3. After opening the pending order, we shall move the stop to the next fractal low following the Bollinger and Parabolic signals. Thus, we are changing the potential profit/loss to the breakeven point. More risk-averse traders may switch to the 4-hour chart after the trade and place there a stop loss moving it in the direction of the trade. If the price meets the stop level (12.3) without reaching the order (13.2), we recommend to close the position: the market sustains internal changes that were not taken into account.
Summary of technical analysis
| Position | Buy |
| Buy stop | Above 13.2 |
| Stop loss | Below 12.3 |
- Zertifikat erhalten

Hinweis:
Diese Übersicht hat einen informativen und Tutorencharakter und wird kostenlos veröffentlicht. Alle Daten, die in dieser Übersicht eingeschlossen sind, sind von mehr oder weniger zuverlässigen öffentlichen Quellen erhalten. Außerdem gibt es keine Garantie, dass die angezeigte Information voll und genau ist. Die Übersichten werden nicht aktualisiert. Die ganze Information in jeder Übersicht, einschließlich Meinungen, Hinweise, Charts und alles andere, werden nur für Vertrautmachen veröffentlicht und sind keine Finanzberatung oder Empfehlung. Der ganze Text und sein jeder Teil sowie die Charts können nicht als ein Geschäftsangebot betrachtet werden. Unter keinen Umständen sind IFC Markets und seine Angestellten für die Handlungen, die von jemand anderem während oder nach dem Lesen der Übersicht genommen werden, verantwortlich.
