- Analytik
- Technische Analyse
USD/CAD Technische Analyse - USD/CAD Handel: 2015-07-16
Breaking out of the range
Let us consider the USDCAD pair on daily timeframe. The Bank of Canada cut its benchmark interest rate 0.25% to 0.5% on July 15. The central bank estimates that the economy contracted modestly in the first half of the year due to reduced investments in energy sector as oil prices fell, as well as falling exports of non-energy commodities. Lower demand for commodities as growth slowed in US and China in early 2015 brought down prices for Canada’s exports, creating disinflationary pressures and higher excess capacity. The central bank expects that the growth in non-resource sectors of Canada’s economy will lead the rebound of Canada’s economy starting from the third quarter, and counts on stronger global growth for boost in export demand. The bank revised downward its estimates for 2015 growth, projecting the real GDP will grow 1.1% in 2015 instead of 1.9% growth forecast in April. The central bank cut the interest rate to provide additional monetary stimulus and help exporters. The Canadian dollar is expected to weaken as lower outlook for Canadian growth increased the downside risks to inflation given the uncertain prospects for stronger global growth and no signs for rebound in energy prices.
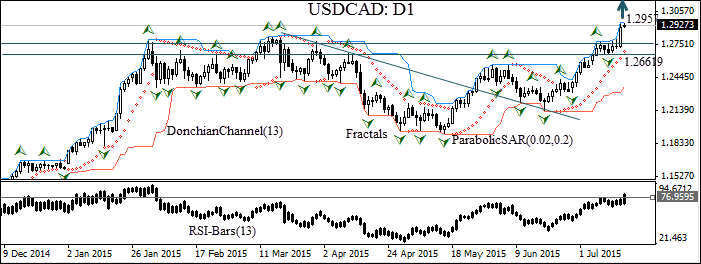
USDCAD has been trading in a range in the past five months. The pair started rising steadily since mid-June. The price gained a full cent and closed above the fractal high on July 15 as the central bank cut the benchmark interest rate. The Parabolic indicator has formed a buy signal. The slope of the Donchian channel indicates upward movement. The RSI-Bars oscillator also confirms the uptrend. We expect the bullish momentum will continue, and the closing of price above the upper Donchian channel at 1.2957 will provide further confirmation of bullish momentum. A pending order to buy can be placed above that level, with the stop loss below the last fractal low at 1.26619. After pending order placing, the stop loss is to be moved every day to the next fractal low, following Parabolic signals. Thus, we are changing the probable profit/loss ratio to the breakeven point. If the price meets the stop loss level without reaching the order, we recommend cancelling the position: the market sustains internal changes which were not considered.
| Position | Buy |
| Buy stop | above 1.2957 |
| Stop loss | below 1.26619 |
- Zertifikat erhalten

Hinweis:
Diese Übersicht hat einen informativen und Tutorencharakter und wird kostenlos veröffentlicht. Alle Daten, die in dieser Übersicht eingeschlossen sind, sind von mehr oder weniger zuverlässigen öffentlichen Quellen erhalten. Außerdem gibt es keine Garantie, dass die angezeigte Information voll und genau ist. Die Übersichten werden nicht aktualisiert. Die ganze Information in jeder Übersicht, einschließlich Meinungen, Hinweise, Charts und alles andere, werden nur für Vertrautmachen veröffentlicht und sind keine Finanzberatung oder Empfehlung. Der ganze Text und sein jeder Teil sowie die Charts können nicht als ein Geschäftsangebot betrachtet werden. Unter keinen Umständen sind IFC Markets und seine Angestellten für die Handlungen, die von jemand anderem während oder nach dem Lesen der Übersicht genommen werden, verantwortlich.
