- Analytik
- Technische Analyse
Weizen / CAD Technische Analyse - Weizen / CAD Handel: 2019-08-12
Weak macro-economic data were released in Canada
In this review, we suggest considering a personal composite instrument (PCI) “Wheat against Canadian dollar”. It rises with gains in wheat price on global market and weakening of Canadian dollar. Will the WHEAT/CAD price increase?
Publication of weak macro data may be a negative factor for Canadian dollar. Unemployment rose to 5.7% in July from 5.5% in June. Employment shrank by 242000. It was worse than expected. Data indicating a decline in building permits were released earlier. Declining crude oil prices may additionally contribute to weakening of Canadian dollar. In past four weeks Brent has fallen 12%. The next Bank of Canada meeting is scheduled for September 4. The likelihood of a quarter point rate cut from current 1.75% is estimated at 23%. Wheat has been rising against the background of rising global demand and drought in US. According to the USDA the US wheat export rose 27% last week and was above 4-week average by 17%. Saudi Arabia loosened its wheat import requirements to allow purchases not only of European but also Russian wheat. And Japan Meteorology Agency said the likelihood of unfavorable weather conditions due to formation of El Nino or La Nina is 60%.
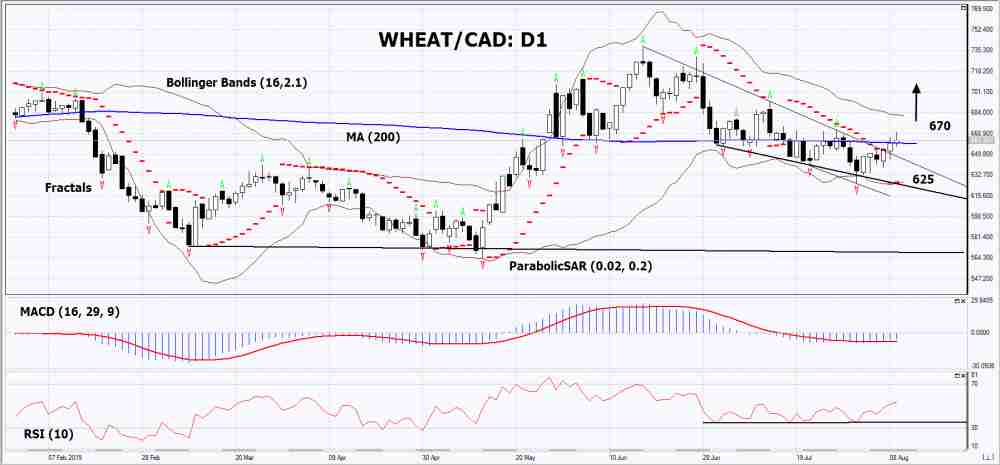
On the daily timeframe WHEAT/CAD: D1 has breached above the resistance line of the downtrend and risen above 200-day moving average MA(200). Some technical analysis indicators have formed bullish signal. Further gain in price is possible in case of wheat shaortage.
- The Parabolic indicator gives bullish signal.
- The Bollinger bands have widened, indicating a volatility increase. Both Bollinger Lines slope upward.
- The RSI indicator is above the 50 mark . It has formed a bullish divergence.
- The MACD indicator gives a bullish signal.
We don’t exclude bullish movement if WHEAT/CAD rises above last fractal high: 670. This level can be used as an entry point. The initial stop loss may be placed below the last fractal low, Bollinger lower line and Parabolic signal: 625. After opening the pending order, the stop shall be moved following the signals of Bollinger and Parabolic to the next fractal low. Thus, we are changing the potential profit/loss to the breakeven point. More risk-averse traders may switch to the 4-hour chart after the trade and place a stop loss moving it in the direction of the trade. If the price meets the stop level (625) without reaching the order (670), we recommend to cancel the order: the market sustains internal changes that were not taken into account.
Technical Analysis Summary
| Position | Buy |
| Buy stop | Above 670 |
| Stop loss | Below 625 |
- Zertifikat erhalten

Hinweis:
Diese Übersicht hat einen informativen und Tutorencharakter und wird kostenlos veröffentlicht. Alle Daten, die in dieser Übersicht eingeschlossen sind, sind von mehr oder weniger zuverlässigen öffentlichen Quellen erhalten. Außerdem gibt es keine Garantie, dass die angezeigte Information voll und genau ist. Die Übersichten werden nicht aktualisiert. Die ganze Information in jeder Übersicht, einschließlich Meinungen, Hinweise, Charts und alles andere, werden nur für Vertrautmachen veröffentlicht und sind keine Finanzberatung oder Empfehlung. Der ganze Text und sein jeder Teil sowie die Charts können nicht als ein Geschäftsangebot betrachtet werden. Unter keinen Umständen sind IFC Markets und seine Angestellten für die Handlungen, die von jemand anderem während oder nach dem Lesen der Übersicht genommen werden, verantwortlich.
