- Analytik
- Technische Analyse
Silber gegen US-Dollar Technische Analyse - Silber gegen US-Dollar Handel: 2019-06-03
After China, the United States entered into a trade conflict with Mexico
Precious metals are becoming more expensive against the backdrop of expanding the geography of global trade wars. The United States can increase import duties not only for China, but also for Mexico. In addition, precious metals can be supported by a reduction in the Fed rate. Will the silver quotations increase?
US President Donald Trump announced a possible increase in import duties for Mexico in response to an increase in the number of illegal immigrants from this country. In his opinion, the Mexican authorities should more actively prevent the illegal emigration of their citizens to the United States. The first duty increase by 5% may already take place on June 10, and by October 1 they will gradually increase by 25%. According to rate futures traded on the Chicago CME, the probability of a Fed rate cut by the end of this year is 90%. Most likely this can be done in September. Thus, market participants believe that the Fed will continue monetary incentives for the economy. Reducing the rate can weaken the dollar and increase the attractiveness of precious metals for investment. Silver is far behind the growth of quotations from gold. The gold / silver price ratio peaked from the 90s.
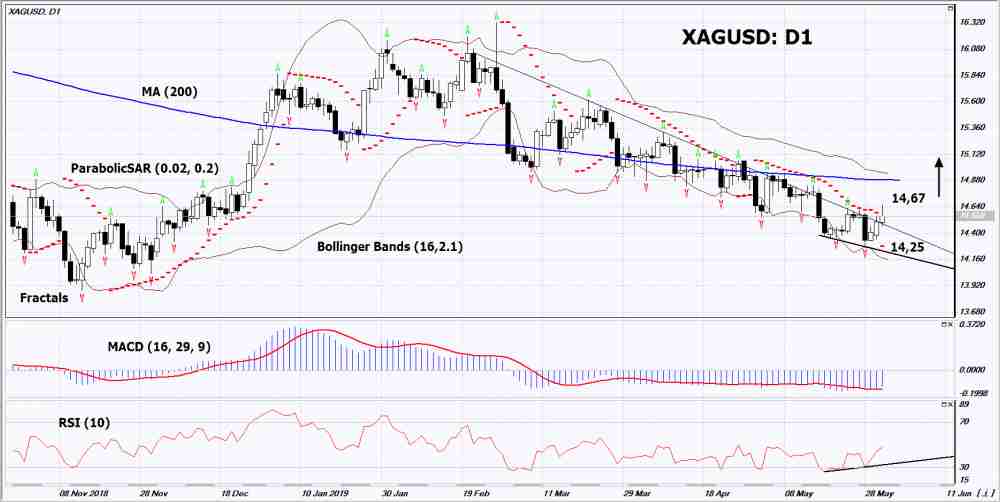
On the daily timeframe XAGUSD: D1 came out of the downtrend. Various technical analysis indicators have generated an uptrend signal. Further growth of quotations is possible in case of an increase in demand for precious metals.
- The Parabolic indicator shows uptrend signal.
- The Bolinger bands expanded, indicating high volatility. Both Bollinger lines are sloping down.
- The RSI indicator is below 50. It has formed a divergence to the increase.
- The MACD indicator gives bullish signal.
The bullish momentum may develop in case if XAGUSD exceeds its last maximum: 14.67. This level may serve as an entry point. The initial stop loss may be placed below the last two lower fractals and the Parabolic signal: 14,25. After opening the pending order, we shall move the stop to the next fractal low following the Bollinger and Parabolic signals. Thus, we are changing the potential profit/loss to the breakeven point. More risk-averse traders may switch to the 4-hour chart after the trade and place a stop loss moving it in the direction of the trade. If the price meets the stop level (14,25) without reaching the order (14,67), we recommend to cancel the order: the market sustains internal changes that were not taken into account.
Technical Analysis Summary
| Position | Buy |
| Buy stop | Above 14,67 |
| Stop loss | Below 14,25 |
- Zertifikat erhalten

Hinweis:
Diese Übersicht hat einen informativen und Tutorencharakter und wird kostenlos veröffentlicht. Alle Daten, die in dieser Übersicht eingeschlossen sind, sind von mehr oder weniger zuverlässigen öffentlichen Quellen erhalten. Außerdem gibt es keine Garantie, dass die angezeigte Information voll und genau ist. Die Übersichten werden nicht aktualisiert. Die ganze Information in jeder Übersicht, einschließlich Meinungen, Hinweise, Charts und alles andere, werden nur für Vertrautmachen veröffentlicht und sind keine Finanzberatung oder Empfehlung. Der ganze Text und sein jeder Teil sowie die Charts können nicht als ein Geschäftsangebot betrachtet werden. Unter keinen Umständen sind IFC Markets und seine Angestellten für die Handlungen, die von jemand anderem während oder nach dem Lesen der Übersicht genommen werden, verantwortlich.
