- Analytik
- Technische Analyse
Silber gegen AUD Technische Analyse - Silber gegen AUD Handel: 2019-05-07
Preparing for the meeting of the Reserve Bank of Australia
In this review, we suggest considering the personal composite instrument (PCI) «XAGAUD». It reflects the price dynamics of silver against the Australian dollar. Is there a possibility for the XAGAUD to rise?
Such a dynamic is observed in case of the strengthening of silver and weakening of the Australian dollar. The next meeting of the Reserve Bank of Australia (RBA) will be held on Tuesday, August 7. The probability of a rate cut to 1.25% from the current level of 1.5% is 40%. Let us recall that both the real decline, and the RBA’s statements about the intention to lower it, can have a negative impact on the exchange rate of the Australian dollar. An additional factor may be the aggravation of trade relations between the US and China after US president Donald Trump’s unexpected announcement of a possible increase in import duties on Chinese goods. Because of this, the next round of trade negotiations between the two countries, scheduled for May 8, may be even postponed. Concerning the growth prospects of silver prices, there can be noted a reduction in world production by 2% last year and a continuing global shortage of this metal. An additional factor may be the alignment of growth rates of silver prices after their strong lag in comparison with more expensive gold. The gold/silver ratio reached the high from October 2008. Relatively cheap silver strongly attracts jewelry buyers. In 2018, silver consumption by the global jewelry industry increased by 6% to 61.1 million ounces.
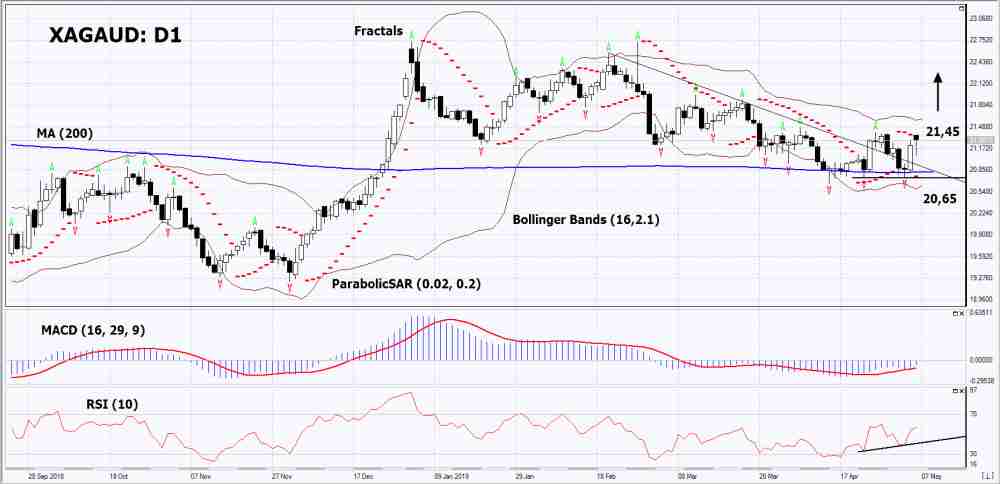
On the daily timeframe, XAGAUD: D1 has moved from the downtrend to the neutral one. A number of technical analysis indicators formed buy signals. The further price increase is possible in case of high demand for silver and easing of the monetary policy by the Reserve Bank of Australia.
- The Parabolic Indicator gives a bullish signal.
- The Bollinger bands have narrowed, which indicates low volatility. Both Bollinger bands are titled upward.
- The RSI indicator is above 50. It has formed a positive divergence.
- The MACD indicator gives a bullish signal.
The bullish momentum may develop in case XAGAUD exceeds the last fractal high at 21.45. This level may serve as an entry point. The initial stop loss may be placed below the 200-day moving average line, the Parabolic signal, the three last fractal lows and the lower Bollinger band at 20.65. After opening the pending order, we shall move the stop to the next fractal low following the Bollinger and Parabolic signals. Thus, we are changing the potential profit/loss to the breakeven point. More risk-averse traders may switch to the 4-hour chart after the trade and place there a stop loss moving it in the direction of the trade. If the price meets the stop level (20.65) without reaching the order (21.45), we recommend to close the position: the market sustains internal changes that were not taken into account.
Summary of technical analysis
| Position | Buy |
| Buy stop | Above 21.45 |
| Stop loss | Below 20.65 |
- Zertifikat erhalten

Hinweis:
Diese Übersicht hat einen informativen und Tutorencharakter und wird kostenlos veröffentlicht. Alle Daten, die in dieser Übersicht eingeschlossen sind, sind von mehr oder weniger zuverlässigen öffentlichen Quellen erhalten. Außerdem gibt es keine Garantie, dass die angezeigte Information voll und genau ist. Die Übersichten werden nicht aktualisiert. Die ganze Information in jeder Übersicht, einschließlich Meinungen, Hinweise, Charts und alles andere, werden nur für Vertrautmachen veröffentlicht und sind keine Finanzberatung oder Empfehlung. Der ganze Text und sein jeder Teil sowie die Charts können nicht als ein Geschäftsangebot betrachtet werden. Unter keinen Umständen sind IFC Markets und seine Angestellten für die Handlungen, die von jemand anderem während oder nach dem Lesen der Übersicht genommen werden, verantwortlich.
